
Section
2 Wave environment
2.1 General
2.1.1 Generally
ships of Naval Ship Groups 1 and 2, NS1 and NS2, see
Vol 1, Pt 1, Ch 2, 2.1 Applicable ship types will
be designed for unrestricted world-wide operation. Ships in group
3, NS3, may also be designed for world-wide operation
but typically will be designed for more specific roles within clearly
defined areas of operation, e.g. coastal patrol craft, landing craft,
harbour vessels, tugs, etc.
2.1.3 The
following definitions are applicable:
Service area
-
A service area refers to a collective group of sea areas.
The service area specifies the limits of the ship’s operational
area.
Sea area
-
A sea area is small area of the world’s oceans for
which statistical wave data has been collected, the sea areas are
shown in Figure 2.2.2 Sea areas.
2.2 Service areas
2.2.1 All
ships classed under the Rules will be assigned a service area notation SA followed by a number or letter, e.g. SA1.
2.2.2 The
service area notations listed below are available. The definitive
extents of the service areas are shown in Figure 2.2.2 Sea areas and Table 2.2.3 Environmental wave data for
individual sea area. The chart shows the
minimum service area requirement for operating in different areas
of the world.
|
SA1
|
= |
Service Area 1 covers
ships having unrestricted world-wide operation. Service area 1 includes
operation in all other service areas. |
|
SA2
|
= |
Service Area 2 is
primarily intended to cover ships designed to operate in tropical
and temperate regions, see
Vol 1, Pt 5, Ch 2, 2.2 Service areas 2.2.3. This service area excludes operating in sea areas for
which a SA1 notation is required.
|
|
SA3
|
= |
Service Area 3 is
primarily intended to cover ships designed to operate in tropical
regions, see
Vol 1, Pt 5, Ch 2, 2.2 Service areas 2.2.3.
This service area excludes operating in sea areas for which a SA1 or SA2 notation is required.
|
|
SA4
|
= |
Service Area 4 covers
ships designed to operate in Sheltered water, as defined in Vol 1, Pt 1, Ch 2, 2.2 Definitions 2.2.14. This service
area excludes operating in sea areas for which a SA1, SA2 or SA3 notation is required.
|
2.2.3 For
all ships that are designed for specific areas of operation, the designer
may take advantage of reduced wave loadings that are likely to be
encountered. This covers all ships which are assigned a service area
notation SA2, SA3, SA4 or SAR.
2.2.4 For
all cases where a SAR service area notation (Service
Area Restricted) is required, the extents of the restricted area will
be specified after the SAR service area notation. The
service area factor, f
s, and the wave environment
characteristics for the ship will be specially considered. Where the
geographical limits of the intended service can be satisfied by a
single or group of contiguous sea areas then the service area factor, f
s, and the wave environment characteristics may
be derived using the methods given in Vol 1, Pt 5, Ch 2, 2.4 Service area factors and Vol 1, Pt 5, Ch 2, 2.5 Derivation of wave statistics for a combination of sea areas.
2.2.5 Under
normal circumstances, a ship which is assigned a service area notation SA2, SA3, SA4 or SAR is to operate in solely the
designated area and is not transit to other areas of the world, see
Vol 1, Pt 1, Ch 2, 3.5 Ship type notations. Due
allowance is to be made for the ship’s trials, work-up period
and delivery voyages in the assignment of a service area notation.
However special consideration may be appropriate to these periods
in order to ensure that the ship is not subjected to dynamic loads
which might impair the structural working life of the ship.
2.2.7 It is
the responsibility of the Owner to determine that the chosen Service
Area, the service area factor, f
s, and the
wave environment characteristics as defined in Vol 1, Pt 5, Ch 2, 2.3 Wave environment are appropriate for the intended
areas of operation.
2.2.8 The
allocation of a service area notation to a ship does not remove the
responsibility of the Master or commanding officer to take suitable
measures to avoid typhoon, hurricane and other extreme weather conditions,
as appropriate.
2.2.9 The
requirements for ships which are required to maintain station or operate
in typhoon, hurricane and other extreme weather conditions will be
specially considered.
2.3 Wave environment
2.3.2 The
definitions of wave height, wave period and wave period range given
below are to be used in the determination of the environmental loads
acting on the ship.
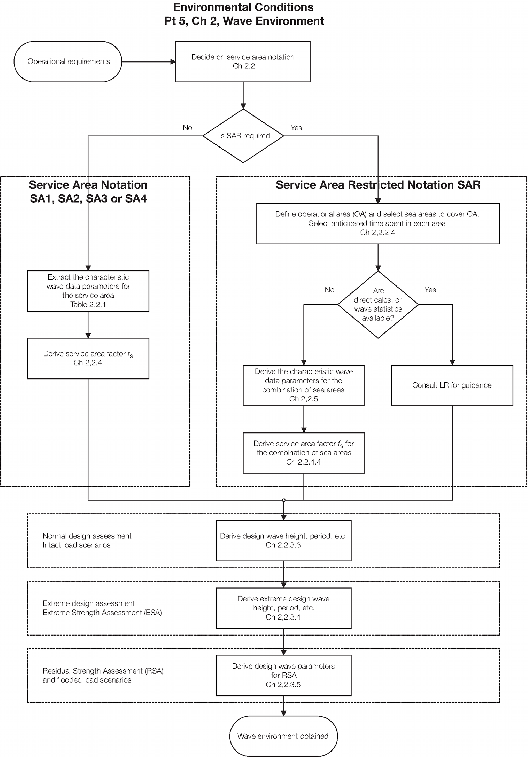
Figure 2.2.1 Procedure for the specification of environmental conditions
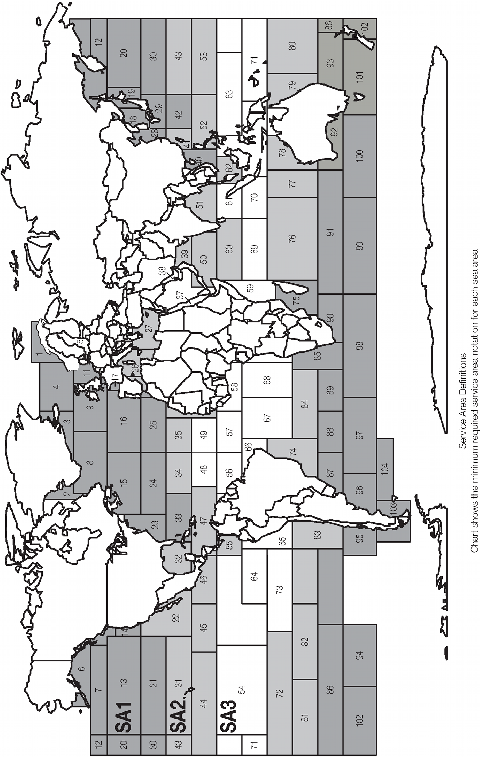
Figure 2.2.2 Sea areas
Table 2.2.1 Environmental wave data for each
service area
| Service Area Notation
|
Wave height for the service area,
m
|
Mean wave period, seconds
|
Standard deviation of wave period,
seconds
|
Extreme design wave height,
m
|
|
|
H
s
|
T
z
|
T
sd
|
H
x
|
|
SA1
|
5,5
|
8,0
|
1,7
|
18,5
|
|
SA2
|
4,0
|
7,0
|
1,7
|
13,5
|
|
SA3
|
3,6
|
6,8
|
1,7
|
9,5
|
|
SA4
|
2,5
|
6,0
|
1,5
|
6,0
|
|
SAR
|
To be specially considered
|
|
|
2.3.3 Wave
environmental design criteria for normal design assessment. These
design parameters have been used to derive the standard local and
global environmental loadings in Vol 1, Pt 5, Ch 3 Local Design Loads and Vol 1, Pt 5, Ch 4 Global Design Loads. All direct calculations
and model tests required to supplement these loads are to use these
environmental loadings.
Design wave height, H
dw
-
Average of the one hundredth highest observed wave heights
for the service area. To be taken as:
H
dw = 1,67H
s m
Design wave period, T
dw
-
Average zero crossing period of all sea states in the service
area
T
dw = T
z seconds
Standard deviation of wave period, T
dsd
-
Standard deviation of the zero crossing periods for the
service area
T
dsd = T
sd seconds
Design wave period range, T
drange
-
To be taken as the design wave period plus and minus 2 standard
deviations of the zero crossing period, i.e.
T
drange is T
dw –
2T
dsd to T
dw + 2T
dsd seconds
H
s, T
z and T
sd are given in Vol 1, Pt 5, Ch 2, 2.3 Wave environment 2.3.6.
2.3.4 Wave
environmental design criteria for extreme design analysis, ESA notations.
These design parameters have been used to derive the global environmental
loadings in Vol 1, Pt 5, Ch 4 Global Design Loads which are
used for the extreme strength assessment notation. All direct calculations
and model tests required to supplement these loads are to use these
environmental loadings.
Extreme wave height, H
xw
-
To be taken as the significant wave height that has a probability
of 5 x 10⁻⁵ of being exceeded.
H
xw = H
x m
Extreme wave period, T
xw
-
To be taken as the design wave period plus one standard
deviation
T
xw = T
dw + T
dsd seconds
Extreme wave period range, T
xrange
-
To be taken as the extreme design wave period plus and minus
1,5 standard deviations
T
xrange is T
xw –
1,5T
dsd to T
xw + 1,5T
dsd seconds
Duration of extreme storm
-
It is to be assumed that extreme storm events are to persist
for three hours.
T
sd and H
x are
given in Vol 1, Pt 5, Ch 2, 2.3 Wave environment 2.3.6
T
dw and T
dsd is given in Vol 1, Pt 5, Ch 2, 2.3 Wave environment 2.3.3.
2.3.5 Wave
environmental design criteria for residual strength analysis, RSA notations.
These design parameters have been used to derive the global and local
environmental loadings in Vol 1, Pt 5, Ch 3 Local Design Loads and Vol 1, Pt 5, Ch 4 Global Design Loads which are used for the residual strength
assessment notation. All direct calculations and model tests required
to supplement these loads are to use these environmental loadings.
Residual wave height, H
rw
-
To be taken as the significant wave height that has a 20
per cent probability of being exceeded for the service area
H
rw = 0,90H
s m
Residual wave period, T
rw
-
To be taken as the standard design wave period
T
dw = T
z seconds
Residual wave period range, T
rrange
-
To be taken as the standard design wave period range
T
rrange = T
drange seconds
Duration of sea state
-
It is to be assumed that the duration of sea states of this
magnitude is 12 hours.
H
s and T
z are
given in Vol 1, Pt 5, Ch 2, 2.3 Wave environment 2.3.6
T
drange is given in Vol 1, Pt 5, Ch 2, 2.3 Wave environment 2.3.3.
2.4 Service area factors
2.4.1 The service area factor, fs, is used to derive the global
hull girder loads in Vol 1, Pt 5, Ch 4 Global Design Loads. The service area factor applicable for Service Area
notations SA1, SA2, SA3 and SA4 is given by:
|
fs
|
= |
(f
1 + f
2 (L
WL – 100) /1000 ) fsl
|
where
-
fs is to have a minimum value of 0,5 and normally a maximum
value of 1,0 and is to be rounded up to the nearest 0,05
fsl is the service life factor as defined in Vol 1, Pt 5, Ch 2, 2.4 Service area factors 2.4.2
f1 and f
2 are given in Table 2.2.2 Environmental wave data for
service area
LWL is defined in Vol 1, Pt 3, Ch 1, 5.2 Principal particulars.
2.4.2 The service life factor, fsl, is based on a ship’s
operational life. This factor may need to be increased for service lives which are
predicted to require significantly more wave encounters. The service life factor is to
be taken as follows:
|
fsl |
= |
1,0 for 1 x 10⁸ wave encounters (20 years)
|
| = |
1,010 for 1,25 x 10 8 wave encounters
(25 years)
|
| = |
1,019 for 1,5 x 10 8 wave encounters
(30 years)
|
Table 2.2.2 Environmental wave data for
service area
| Service Area Notation
|
Intercept
factor
f1
|
Slope
factor
f2
|
|
SA1
|
1,00
|
0,00
|
|
SA2
|
0,93
|
–1,15
|
|
SA3
|
0,70
|
–1,00
|
|
SA4
|
0,50
|
0,00
|
|
SAR
|
To be specially considered
|
2.4.3 For unrestricted sea-going service, i.e. service area notation SA1,
the service area factor is to be taken as 1,0fsl.
2.5 Derivation of wave statistics for a combination of sea areas
2.5.1 For
the SAR restricted service area notation, it is necessary
to derive the environmental wave data for the required area of operation.
This data may be determined using statistical methods as specified
in Vol 1, Pt 5, Ch 2, 2.6 Direct calculations or using the information
given in this Section.
2.5.2 The
following formulae may be used to derive the design wave statistics
for a ship designed to operate with a particular service area restriction.
These formulae enable the environmental wave data from a set of individual
sea areas to be combined to give the appropriate design wave statistics
for the SAR restricted service area notation, see
also
Vol 1, Pt 5, Ch 2, 2.2 Service areas.
2.5.3 The
environmental wave data for each sea area is given in Table 2.2.4 Environmental wave data for each
sea area The extents of each
sea area are shown in Figure 2.2.2 Sea areas
Wave height, H
s
|
H
s
|
= |
weighted average of the wave height for all sea areas plus one
standard deviation |
| = |

|
where
|
H
sm
|
= |

|
Design wave period, T
dw
|
T
dw
|
= |
weighted average of the wave period for all sea areas |
| = |

|
Standard deviation of wave period, T
sd
|
T
sd
|
= |
weighted average of the standard deviation for all sea areas
about the combined design wave period, T
dw
|
| = |

|
Extreme wave height, H
x
|
H
x
|
= |
weighted average of the extreme wave height for all sea areas
plus one standard deviation |
| = |

|
where
|
H
xm
|
= |

|
|
N
|
= |
is the number of sea
areas |
|
i
|
= |
is the sea area index
reference |
|
P
i
|
= |
is the
probability of the ship operating in sea area i, i.e.
the percentage of time, expressed as a probability value
|
|
H
si
|
= |
is the
appropriate sea area wave height value for sea area i
|
|
H
xi
|
= |
is the
appropriate extreme wave height value for sea area i
|
|
T
zi
|
= |
is the
appropriate zero crossing period for sea area i
|
|
T
sdi
|
= |
is the
appropriate standard deviation for sea area i
|
2.5.4 The
designer/Builder is to supply full details of the SAR notation
required together with full supporting calculations. All transit voyages
and ship work-up/trial periods should be included in the list of sea
areas if their inclusion results in a more severe wave environment, see also
Vol 1, Pt 5, Ch 2, 2.2 Service areas 2.2.5
2.6 Direct calculations
2.6.1 The
wave environmental parameters may be derived by direct calculation
using long term statistical wave data for the selected area(s) of
operation based on hindcast data or similar analysis. This data is
to represent accurately the sea environment in the intended area of
operation over a long period and enable sound long term and extreme
short term statistics to be derived. Depending on the area of operation,
due account is to be taken of typhoon, hurricane and other seasonal
extremes, see also
Vol 1, Pt 5, Ch 2, 2.2 Service areas 2.2.8
Table 2.2.3 Environmental wave data for
individual sea area
| Sea Area
No.
|
Minimum service
area notation required to operate in this sea area
|
Intercept factor
f
1i
|
Slope factor
f
2i
|
Sea Area
No.
|
Minimum service
area notation required to operate in this sea area
|
Intercept factor
f
1i
|
Slope factor
f
2i
|
| 1
|
SA1
|
1,13
|
–1,97
|
51
|
SA2
|
0,82
|
–1,89
|
| 2
|
SA2
|
0,94
|
–1,81
|
52
|
SA2
|
0,87
|
–1,43
|
| 3
|
SA1
|
1,13
|
–1,97
|
53
|
SA2
|
0,74
|
–0,84
|
| 4
|
SA1
|
1,01
|
–1,01
|
54
|
SA3
|
0,62
|
–0,65
|
| 5
|
SA3
|
0,72
|
–1,85
|
55
|
SA2
|
0,78
|
–0,97
|
| 6
|
SA1
|
1,08
|
–1,33
|
56
|
SA3
|
0,63
|
–0,71
|
| 7
|
SA1
|
0,89
|
–0,16
|
57
|
SA3
|
0,56
|
–0,77
|
| 8
|
SA1
|
0,98
|
0,17
|
58
|
SA3
|
0,57
|
–1,13
|
| 9
|
SA1
|
1,00
|
0,02
|
59
|
SA3
|
0,69
|
–1,15
|
| 10
|
SA1
|
1,11
|
–1,80
|
60
|
SA2
|
0,87
|
–1,43
|
|
|
|
|
|
|
|
|
|
| 11
|
SA1
|
1,18
|
–2,56
|
61
|
SA3
|
0,69
|
–1,15
|
| 12
|
SA1
|
1,19
|
–1,44
|
62
|
SA2
|
0,85
|
–2,13
|
| 13
|
SA1
|
0,96
|
–0,48
|
63
|
SA3
|
0,69
|
–1,31
|
| 14
|
SA1
|
0,96
|
–0,81
|
64
|
SA3
|
0,59
|
–0,55
|
| 15
|
SA1
|
1,01
|
–0,34
|
65
|
SA3
|
0,55
|
–0,43
|
| 16
|
SA1
|
1,00
|
0,02
|
66
|
SA3
|
0,59
|
–0,55
|
| 17
|
SA1
|
1,03
|
–0,64
|
67
|
SA3
|
0,63
|
–0,71
|
| 18
|
SA1
|
1,11
|
–3,45
|
68
|
SA3
|
0,65
|
–0,83
|
| 19
|
SA1
|
1,10
|
–1,52
|
69
|
SA3
|
0,68
|
–0,97
|
| 20
|
SA1
|
1,10
|
–0,83
|
70
|
SA3
|
0,67
|
–0,58
|
|
|
|
|
|
|
|
|
|
| 21
|
SA1
|
0,88
|
–0,53
|
71
|
SA3
|
0,69
|
–1,50
|
| 22
|
SA2
|
0,80
|
–1,29
|
72
|
SA2
|
0,63
|
–0,32
|
| 23
|
SA1
|
1,00
|
–1,65
|
73
|
SA3
|
0,64
|
–0,33
|
| 24
|
SA1
|
1,01
|
–0,50
|
74
|
SA2
|
0,74
|
–0,84
|
| 25
|
SA1
|
0,90
|
–0,42
|
75
|
SA1
|
0,85
|
–0,65
|
| 26
|
SA2
|
0,98
|
–2,43
|
76
|
SA2
|
0,77
|
–0,19
|
| 27
|
SA2
|
0,98
|
–2,43
|
77
|
SA2
|
0,79
|
–0,20
|
| 28
|
SA2
|
0,98
|
–2,43
|
78
|
SA2
|
0,86
|
–0,98
|
| 29
|
SA1
|
1,06
|
–2,05
|
79
|
SA2
|
0,87
|
–1,42
|
| 30
|
SA1
|
1,01
|
–0,50
|
80
|
SA2
|
0,78
|
–0,56
|
|
|
|
|
|
|
|
|
|
| 31
|
SA2
|
0,74
|
–0,44
|
81
|
SA2
|
0,79
|
–0,20
|
| 32
|
SA2
|
0,82
|
–1,89
|
82
|
SA2
|
0,74
|
–0,44
|
| 33
|
SA1
|
0,75
|
–1,01
|
83
|
SA2
|
0,75
|
–0,58
|
| 34
|
SA2
|
0,78
|
–0,70
|
84
|
SA2
|
0,73
|
–0,69
|
| 35
|
SA2
|
0,73
|
–0,76
|
85
|
SA1
|
0,80
|
–0,15
|
| 36
|
SA2
|
0,75
|
–1,16
|
86
|
SA1
|
0,89
|
–0,26
|
| 37
|
SA3
|
0,72
|
–1,85
|
87
|
SA1
|
0,91
|
–0,51
|
| 38
|
SA3
|
0,69
|
–2,13
|
88
|
SA1
|
0,89
|
–0,16
|
| 39
|
SA2
|
0,85
|
–2,14
|
89
|
SA1
|
0,98
|
–0,08
|
| 40
|
SA1
|
1,05
|
–1,97
|
90
|
SA1
|
0,98
|
–0,08
|
|
|
|
|
|
|
|
|
|
| 41
|
SA1
|
1,00
|
–1,65
|
91
|
SA1
|
0,98
|
–0,08
|
| 42
|
SA2
|
0,98
|
–1,31
|
92
|
SA1
|
0,90
|
0,09
|
| 43
|
SA2
|
0,78
|
–0,54
|
93
|
SA1
|
0,90
|
–0,32
|
| 44
|
SA2
|
0,78
|
–0,54
|
94
|
SA1
|
0,98
|
0,31
|
| 45
|
SA2
|
0,64
|
–0,34
|
95
|
SA1
|
0,89
|
–0,16
|
| 46
|
SA2
|
0,75
|
–1,22
|
96
|
SA1
|
1,00
|
–0,91
|
| 47
|
SA2
|
0,75
|
–1,01
|
97
|
SA1
|
0,98
|
0,16
|
| 48
|
SA3
|
0,65
|
–0,78
|
98
|
SA1
|
0,89
|
0,21
|
| 49
|
SA3
|
0,68
|
–0,94
|
99
|
SA1
|
0,98
|
0,30
|
| 50
|
SA2
|
1,09
|
–2,70
|
100
|
SA1
|
1,03
|
0,52
|
|
|
|
|
|
|
|
|
|
|
|
|
|
|
101
|
SA1
|
0,98
|
–0,18
|
|
|
|
|
|
102
|
SA1
|
0,89
|
–0,16
|
|
|
|
|
|
103
|
SA1
|
1,06
|
–0,23
|
|
|
|
|
|
104
|
SA1
|
0,89
|
-0,26
|
2.6.2 The
derivation of the wave environmental parameters is to be in accordance
with the data specification and methods given in Vol 1, Pt 5, Ch 2, 2.3 Wave environment. The areas used for the direct
calculation will then be specified after the SAR service
area restriction notation.
Table 2.2.4 Environmental wave data for each
sea area
| Sea Area No.
|
Sea area wave
height
in metres
|
Mean wave
period
in seconds
|
Standard deviation of
wave period
in seconds
|
Extreme design wave
height
in metres
|
Sea Area No.
|
Sea area wave
height
in metres
|
Mean wave
period
in seconds
|
Standard deviation of
wave period
seconds
|
Extreme design wave
height
in metres
|
|
|
H
si
|
T
zi
|
T
sdi
|
H
xi
|
|
H
si
|
T
zi
|
T
sdi
|
H
xi
|
| 1
|
3,6
|
6,4
|
1,3
|
16,9
|
53
|
3,7
|
7,5
|
1,5
|
10,0
|
| 2
|
3,0
|
6,2
|
1,3
|
12,5
|
54
|
3,5
|
7,7
|
1,5
|
8,9
|
| 3
|
4,3
|
7,5
|
1,4
|
17,6
|
55
|
2,5
|
6,2
|
1,3
|
7,4
|
| 4
|
4,4
|
7,4
|
1,4
|
16,2
|
56
|
3,4
|
7,4
|
1,5
|
8,6
|
| 5
|
2,5
|
5,2
|
1,1
|
8,6
|
57
|
3,1
|
7,1
|
1,5
|
7,8
|
| 6
|
4,2
|
7,4
|
1,4
|
15,6
|
58
|
2,5
|
6,1
|
1,3
|
7,1
|
| 7
|
5,0
|
8,4
|
1,5
|
15,4
|
59
|
2,9
|
6,3
|
1,3
|
9,2
|
| 8
|
5,5
|
8,6
|
1,5
|
18,4
|
60
|
3,0
|
6,3
|
1,3
|
11,5
|
| 9
|
5,3
|
8,5
|
1,5
|
18,2
|
61
|
3,0
|
6,5
|
1,3
|
9,0
|
| 10
|
3,7
|
6,7
|
1,3
|
15,8
|
62
|
2,5
|
5,5
|
1,2
|
11,0
|
|
|
|
|
|
|
|
|
|
|
|
| 11
|
3,4
|
6,1
|
1,2
|
17,0
|
63
|
2,7
|
6,2
|
1,3
|
8,4
|
| 12
|
5,0
|
7,8
|
1,4
|
18,3
|
64
|
3,4
|
7,5
|
1,5
|
8,2
|
| 13
|
4,8
|
8,3
|
1,5
|
16,2
|
65
|
2,9
|
7,1
|
1,5
|
8,2
|
| 14
|
4,0
|
7,7
|
1,5
|
14,5
|
66
|
3,4
|
7,3
|
1,5
|
8,1
|
| 15
|
4,7
|
8,0
|
1,4
|
17,9
|
67
|
3,5
|
7,4
|
1,5
|
8,9
|
| 16
|
5,2
|
8,4
|
1,5
|
19,2
|
68
|
3,5
|
7,2
|
1,4
|
8,7
|
| 17
|
4,3
|
7,8
|
1,4
|
18,3
|
69
|
3,2
|
7,2
|
1,5
|
9,2
|
| 18
|
2,7
|
4,9
|
1,0
|
14,5
|
70
|
3,4
|
7,6
|
1,5
|
9,7
|
| 19
|
3,8
|
7,0
|
1,4
|
17,5
|
71
|
2,5
|
5,9
|
1,3
|
8,3
|
| 20
|
4,8
|
8,0
|
1,4
|
18,4
|
72
|
3,6
|
7,7
|
1,5
|
9,5
|
|
|
|
|
|
|
|
|
|
|
|
| 21
|
4,4
|
8,1
|
1,5
|
14,0
|
73
|
4,0
|
8,0
|
1,5
|
9,4
|
| 22
|
3,3
|
7,0
|
1,4
|
10,7
|
74
|
3,3
|
7,2
|
1,4
|
10,6
|
| 23
|
3,4
|
6,5
|
1,3
|
15,2
|
75
|
3,9
|
7,8
|
1,5
|
13,0
|
| 24
|
4,6
|
8,0
|
1,5
|
17,4
|
76
|
4,4
|
8,2
|
1,5
|
12,5
|
| 25
|
4,4
|
8,1
|
1,5
|
14,5
|
77
|
4,6
|
8,3
|
1,5
|
12,6
|
| 26
|
2,7
|
5,5
|
1,2
|
13,6
|
78
|
3,8
|
7,6
|
1,5
|
12,0
|
| 27
|
2,6
|
5,6
|
1,2
|
13,2
|
79
|
3,3
|
6,5
|
1,3
|
11,2
|
| 28
|
2,8
|
5,5
|
1,1
|
12,4
|
80
|
3,7
|
7,7
|
1,5
|
12,2
|
| 29
|
3,4
|
6,3
|
1,3
|
15,5
|
81
|
4,4
|
8,2
|
1,5
|
12,7
|
| 30
|
4,7
|
8,2
|
1,5
|
16,8
|
82
|
4,1
|
8,0
|
1,5
|
11,3
|
|
|
|
|
|
|
|
|
|
|
|
| 31
|
3,8
|
7,8
|
1,5
|
11,5
|
83
|
3,8
|
7,8
|
1,5
|
11,2
|
| 32
|
2,8
|
5,8
|
1,2
|
10,0
|
84
|
4,3
|
8,2
|
1,5
|
10,8
|
| 33
|
3,2
|
6,8
|
1,4
|
11,5
|
85
|
4,9
|
8,4
|
1,5
|
13,3
|
| 34
|
3,6
|
7,6
|
1,5
|
11,5
|
86
|
4,6
|
8,2
|
1,5
|
15,7
|
| 35
|
3,9
|
7,9
|
1,5
|
10,3
|
87
|
3,8
|
7,7
|
1,5
|
16,8
|
| 36
|
3,3
|
6,9
|
1,4
|
9,5
|
88
|
5,0
|
8,5
|
1,5
|
15,3
|
| 37
|
2,3
|
5,1
|
1,1
|
8,5
|
89
|
4,8
|
8,3
|
1,5
|
18,2
|
| 38
|
1,8
|
4,5
|
0,9
|
8,3
|
90
|
5,2
|
8,5
|
1,5
|
17,9
|
| 39
|
2,5
|
5,2
|
1,1
|
10,5
|
91
|
5,4
|
8,6
|
1,5
|
17,7
|
| 40
|
3,5
|
6,3
|
1,2
|
13,4
|
92
|
5,2
|
8,5
|
1,5
|
16,7
|
|
|
|
|
|
|
|
|
|
|
|
| 41
|
3,7
|
6,6
|
1,3
|
14,0
|
93
|
4,2
|
8,0
|
1,5
|
15,3
|
| 42
|
3,6
|
6,9
|
1,4
|
15,2
|
94
|
6,0
|
8,9
|
1,4
|
17,7
|
| 43
|
4,1
|
7,9
|
1,5
|
12,1
|
95
|
5,5
|
8,7
|
1,5
|
14,6
|
| 44
|
4,0
|
8,0
|
1,5
|
10,1
|
96
|
4,0
|
7,5
|
1,4
|
16,9
|
| 45
|
3,7
|
7,8
|
1,5
|
9,5
|
97
|
5,6
|
8,7
|
1,5
|
17,3
|
| 46
|
2,8
|
6,4
|
1,3
|
10,7
|
98
|
5,6
|
8,7
|
1,5
|
16,7
|
| 47
|
3,4
|
6,6
|
1,3
|
10,0
|
99
|
6,1
|
9,0
|
1,4
|
18,0
|
| 48
|
3,6
|
7,6
|
1,5
|
9,2
|
100
|
6,0
|
8,9
|
1,4
|
20,1
|
| 49
|
3,5
|
7,3
|
1,4
|
9,0
|
101
|
4,9
|
8,4
|
1,5
|
17,1
|
| 50
|
3,1
|
5,8
|
1,2
|
14,1
|
102
|
4,8
|
8,3
|
1,5
|
16,5
|
|
|
|
|
|
|
|
|
|
|
|
| 51
|
2,7
|
5,8
|
1,2
|
10,4
|
103
|
5,3
|
8,5
|
1,5
|
18,2
|
| 52
|
3,2
|
6,5
|
1,3
|
12,2
|
104
|
4,7
|
8,2
|
1,5
|
16,6
|
Note
1. The sea area wave height H
si and wave zero crossing period, T
zi, are based on the annual, all directions wave data
scatter diagram.
Note
2. The sea area wave height H
si is the average of the one third highest observed (or
significant) wave heights in the wave scatter diagram.
Note
3. The T
zi and standard deviation of T
sdi are derived using all wave heights in the wave data
scatter diagram.
Note
4. The extreme design wave height,
H
xi, is based on a Gumbel projection using the following
data set definition:
A wave data scatter diagram based
on integer parts per ten thousand. (Note using a higher precision
scatter diagram will result in a higher estimate of extreme wave
height).
Probability of exceedence of 5 x10⁻⁵, roughly
equivalent to 6,5 years continuously at sea in each sea area.
Note
5. The values of H
si, T
zi, and T
sdi were derived from the data set used for the extreme
wave height.
|
|