
Section
2 Evaluation of test results
2.1 Principles
2.1.1 Prior to fatigue testing, the crankshaft must be tested as required by quality
control procedures, e.g. for chemical composition, mechanical properties, surface
hardness, hardness depth and extension, fillet surface finish, etc.
2.1.2 The test samples should be prepared so as to represent the ‘lower end’ of the
acceptance range, e.g. for induction hardened crankshafts this means the lower range
of acceptable hardness depth, the shortest extension through a fillet, etc.
Otherwise the mean value test results should be corrected with a confidence
interval: a 90 per cent confidence interval may be used both for the sample mean and
the standard deviation.
2.1.3 The test results, when applied as required by Pt 5, Ch 2, 3 Crankshaft Design of the Rules and Regulations for the Classification of Ships, July 2022, shall be evaluated to represent the mean
fatigue strength, with or without taking into consideration the 90 per cent
confidence interval mentioned above. The standard deviation should be considered by
taking the 90 per cent confidence into account. Subsequently, the result to be used
as the fatigue strength is then the mean fatigue strength minus one standard
deviation.
2.1.4 If the evaluation aims to find a relationship between (static) mechanical properties
and the fatigue strength, the relation must be based on the real (measured)
mechanical properties, not on the specified minimum properties.
2.2 Staircase method
2.2.1 In the original staircase method, the first specimen is subjected to a stress
corresponding to the expected average fatigue strength. If the specimen survives
107 cycles, it is discarded and the next specimen is subjected to a
stress that is one increment above the previous, i.e. a survivor is always followed
by the next using a stress one increment above the previous. The increment should be
selected to correspond to the expected level of the standard deviation.
2.2.2 When a specimen fails prior to reaching 107 cycles, the obtained number of
cycles is noted and the next specimen is subjected to a stress that is one increment
below the previous. With this approach, the sum of failures and run-outs is equal to
the number of specimens.
2.2.3 This original staircase method is only suitable when a high number of specimens are
available. Through simulations it has been found that the use of about 25 specimens
in a staircase test leads to a sufficient accuracy in the result.
2.3 Modified staircase method
2.3.1 When a limited number of specimens are available, it is advisable to apply the
modified staircase method. With this method, the first specimen is subjected to a
stress level that is most likely well below the average fatigue strength. When this
specimen has survived 107 cycles, this same specimen is subjected to a
stress level one increment above the previous. The increment should be selected to
correspond to the expected level of the standard deviation. This is continued with
the same specimen until failure. Then the number of cycles is recorded, and the next
specimen is subjected to a stress that is at least two increments below the level
where the previous specimen failed.
2.3.2 With this approach the number of failures usually equals the number of specimens. The
number of run-outs, counted as the highest level where 107 cycles were
reached, also equals the number of specimens.
2.3.3 The acquired result of a modified staircase method should be used with
care, since some results available indicate that testing a run-out on a higher test
level, especially at high mean stresses, tends to increase the fatigue limit.
However, this ‘training effect’ is less pronounced for high strength steels (e.g.
UTS > 800 MPa).
2.3.4 If the confidence calculation is desired or necessary, the minimum number of test
specimens is three.
2.4 Calculation of sample mean and standard deviation
2.4.1 A hypothetical example of tests for five crank throws is presented
further in the subsequent text. When using the modified staircase method and the
evaluation method of Dixon and Mood, the number of samples will be 10, meaning five
run-outs and five failures, i.e.:
Furthermore, the method distinguishes between:
|
|
Less frequent event is failures
|
C=1
|
|
|
Less frequent event is run-outs
|
C=2
|
2.4.2 The method uses only the less frequent occurrence in the test results,
i.e. if there are more failures than run-out, then the number of run-outs is used,
and vice versa.
2.4.3 In the modified staircase method, the number of run-outs and failures are usually
equal. However, the testing can be unsuccessful, e.g. the number of run-outs can be
less than the number of failures if a specimen with two increments below the
previous failure level goes directly to failure. On the other hand, if this
unexpected premature failure occurs after a rather high number of cycles, it is
possible to define the level below this as a run-out.
2.4.4 Dixon and Mood’s approach, derived from the maximum likelihood theory,
which may also be applied here, especially on tests with few samples, presents some
simple approximate equations for calculating the sample mean and the standard
deviation from the outcome of the staircase test. The sample mean can be calculated
as follows:
|
|

|
when C=1
|
|
|

|
when C=2
|
The standard deviation can be found by:
where:
Sa0 is the lowest stress level for the less frequent occurrence
d is the stress increment
|
F |
= |
Σ fi |
|
A |
= |
Σ i·fi |
|
B |
= |
Σ i2·fi |
i is the stress level numbering
fi is the number of samples at stress level i
2.4.5 The formula for the standard deviation is an approximation and can be
used when:
 and and 
If any of these two conditions are not fulfilled, a new staircase test should be
considered, or the standard deviation should be taken quite large in order to be on
the safe side.
2.4.6 If increment d is much higher than the standard deviation
s, the procedure leads to a lower standard deviation and a slightly higher
sample mean, both compared to values calculated when the difference between the
increment and the standard deviation is relatively small. Respectively, if increment
d is much less than the standard deviation s, the procedure leads
to a higher standard deviation and a slightly lower sample mean.
2.5 Confidence interval for mean fatigue limit
2.5.1 If the staircase fatigue test is repeated, the sample mean and the standard deviation
will most likely be different from the previous test. Therefore it is necessary to
assure with a given confidence that the repeated test values will be above the
chosen fatigue limit by using a confidence interval for the sample mean.
2.5.2 The confidence interval for the sample mean value with unknown variance
is known to be distributed according to the t-distribution (also called
Student’s t-distribution), which is a distribution symmetric around the
average.
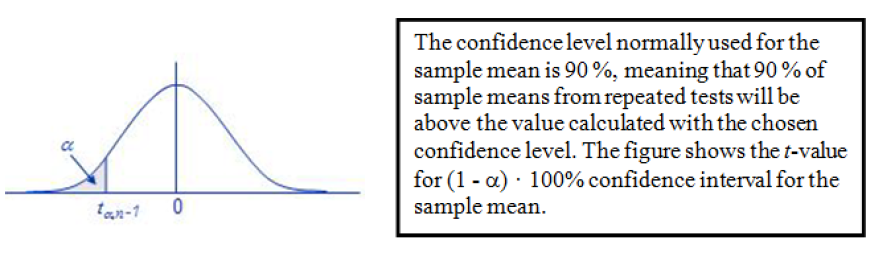
Figure 2.2.1 Student's
t-distribution
2.5.3 If S a is the empirical mean and s is the empirical standard
deviation over a series of n samples, in which the variable values are normally
distributed with an unknown sample mean and unknown variance, the (1 - α) 100 per
cent confidence interval for the mean is:
The resulting confidence interval is symmetric around the empirical mean
of the sample values, and the lower endpoint can be found as:
which is the mean fatigue limit (population value) to be used to obtain the reduced
fatigue limit where the limits for the probability of failure are taken into
consideration.
2.6 Confidence interval for standard deviation
2.6.1 The confidence interval for the variance of a normal random variable is known to
possess a chi-square distribution with n - 1 degrees of freedom.
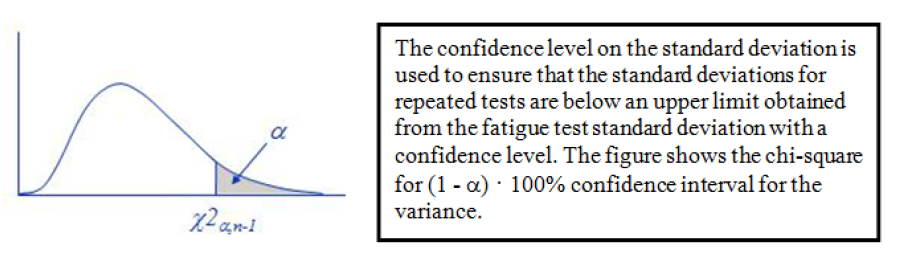
Figure 2.2.2 Chi-square distribution
2.6.2 An assumed fatigue test value from n samples is a normal random variable
with a variance of σ 2 and has an empirical variance s 2.
Therefore a (1 - α) 100 per cent confidence interval for the variance
is:
2.6.3 A (1 – α). 100 per cent confidence interval for the standard deviation is
obtained by the square root of the upper limit of the confidence interval for the
variance, and can be found by:
2.6.4 This standard deviation (population value) is to be used to obtain the fatigue limit,
where the limits for the probability of failure are taken into consideration.
|