1.1.1 The stability should be sufficient to satisfy 2.3 and 2.4 of
this Code.
1.1.2
Heeling moment due to turning
The heeling moment developed during manoeuvring of the craft
in the displacement mode may be derived from the following formula:
where
|
MR
|
= |
moment of heeling; |
|
Vo
|
= |
speed of the craft in
the turn (metres per second); |
|
Δ |
= |
displacement (tonnes); |
|
L |
= |
length of the craft on the waterline
(metres); |
|
KG |
= |
height of the centre of gravity
above keel (metres). |
This formula is applicable when the ratio of the radius of the
turning circle to the length of the craft is 2 to 4.
1.1.3
Relationship between the Capsizing
Moment and Heeling Moment to satisfy the weather criterion
The stability of a hydrofoil boat in the displacement mode can
be checked for compliance with the weather criterion K as follows:
where
- Mc - minimum capsizing moment as determined when account is taken of
rolling:
- Mv - dynamically applied heeling moment due to the wind pressure.
1.1.4
Heeling Moment due to Wind Pressure
The heeling moment Mv is a product of wind pressure
Pv the windage area Av and the lever of windage
area Z.
The value of the heeling moment is taken as constant
during the whole period of heeling.
The windage area Av is
considered to include the projections of the lateral surfaces of the
hull, superstructure and various structures above the waterline. The
windage area lever Z is the vertical distance to the centre of windage
from the waterline and the position of the centre of windage maybe
taken as the centre of the area.
The values of the wind
pressure in Pascal associated with Force 7 Beaufort Scale depending
on the position of the centre of windage area are given in Table 1.
Table 1 Typical Wind Pressures for
Beaufort Scale 7 - 100 Nautical Miles from Land
| Z above waterline (metres)
|
1.0
|
1.5
|
2.0
|
2.5
|
3.0
|
3.5
|
4.0
|
4.5
|
5.0
|
| Pv (Pascal)
|
46
|
46
|
50
|
53
|
56
|
58
|
60
|
62
|
64
|
|
Note: These values may not be applicable in all areas.
|
1.1.5
Evaluation of the Minimum Capsizing
Moment Mc in the displacement mode
The minimum capsizing moment is determined from the static and
dynamic stability curves taking rolling into account.
-
(a) When the static stability curve is used, MC is
determined by equating the areas under the curves of the capsizing
and righting moments (or levers) taking rolling into account - as
indicated by Figure 1, where θz,
is the amplitude of roll and MK is a line drawn parallel to the abscissa
axis such that the shaded areas S1 and S2 are
equal.
|
Mc
|
= |
OM
if the scale of ordinates represents moments |
|
Mc
|
= |
OM
× Displacement if the scale of ordinates represents levers |
-
(b) When the dynamic stability curve is used,
first an auxiliary point A must be determined. For this purpose the
amplitude of heeling is plotted to the right along the abscissa axis
and a point A' is found (see Figure 2).
A line AA' is drawn parallel to the abscissa axis equal to the double
amplitude of heeling (AA'=2θz) and the required
auxiliary point A is found. A tangent AC to the dynamic stability
curve is drawn. From the point A the line AB is drawn parallel to
the abscissa axis and equal to 1 radian (57.3°). From the point
B a perpendicular is drawn to intersect with the tangent in point
E. The distance  is equal to the capsizing moment if measured along the
ordinate axis of the dynamic stability curve. If, however, the dynamic
stability levers are plotted along this axis
is equal to the capsizing moment if measured along the
ordinate axis of the dynamic stability curve. If, however, the dynamic
stability levers are plotted along this axis  is then the capsizing lever, and in this case the capsizing
moment Mc is determined by multiplication of ordinate
is then the capsizing lever, and in this case the capsizing
moment Mc is determined by multiplication of ordinate  in metres by the corresponding displacement in tonnes
|
Mc
|
= |
9.81 Δ  (Kilonewton-metres) (Kilonewton-metres)
|
-
(c) The amplitude of rolling θz,
is determined by means of model and full-scale tests in irregular
seas as a maximum amplitude of rolling of 50 oscillations of a craft
travelling at 90° to the wave direction in sea state for the worst
design condition. If such data are lacking the amplitude is assumed
to be equal to 15°.
-
(d) The effectiveness of the stability curves
should be limited to the angle of flooding.
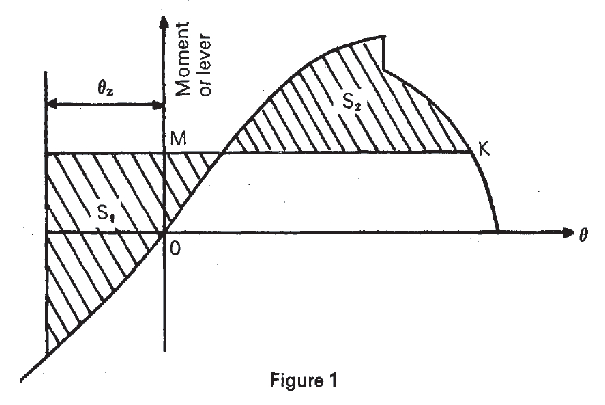
Figure 1 Static Stability Curve
Figure 2 Dynamic Stability Curve