1 The SO2/CO2 ratio method enables direct monitoring of
exhaust gas emissions to verify compliance with emissions limits set out in table 1 in
paragraph 1.3 of these guidelines. In the case of EGC systems that absorb CO2
during the exhaust gas cleaning process it is necessary to measure the CO2
prior to the cleaning process and use the CO2 concentration before cleaning
with the SO2 concentration after cleaning. For conventional low alkali
cleaning systems virtually no CO2 is absorbed during exhaust gas cleaning and
therefore monitoring of both gases can be undertaken after the cleaning process.
2 Correspondence between the SO2/CO2 ratio can be
determined by simple inspection of the respective carbon contents per unit mass of
distillate and residual fuel. For this group of hydrocarbon fuels the carbon content as
a percentage of mass remains closely similar, whereas the hydrogen content differs. Thus
it can be concluded that for a given carbon consumption by combustion there will be a
consumption of sulphur in proportion to the sulphur content of the fuel, or in other
words a constant ratio between carbon and sulphur adjusted for the molecular weight of
oxygen from combustion.
3 The first development of the SO2/CO2 ratio considered
its use to verify compliance with emissions from 1.5% sulphur fuel. The limit of 65
(ppmfootnote/%) SO2/CO2 for 1.5%
sulphur in fuel can be demonstrated by first calculating the mass ratio of fuel sulphur
to fuel carbon, which is tabulated in table 1 in this appendix for various fuels and
fuel sulphur contents; including 1.5% sulphur for both distillate and residual fuels.
These ratios were used to solve for the corresponding SO2 and CO2
concentrations in exhaust, which are tabulated in table 2 of this appendix. Molecular
weights (MW) were taken into account to convert mass fractions to mole fractions. For
the 1.5% sulphur fuels in table 2, the amount of CO2 is set first at 8% and
then changed to 0.5% to show that there is no effect due to changes in excess air. As
expected, the absolute SO2 concentration changes, but the
SO2/CO2 ratio does not. This indicates that the
SO2/CO2 ratio is independent of fuel-to-air ratios. Therefore,
SO2/CO2 ratio can be used robustly at any point of operation,
including operation where no brake power is produced.
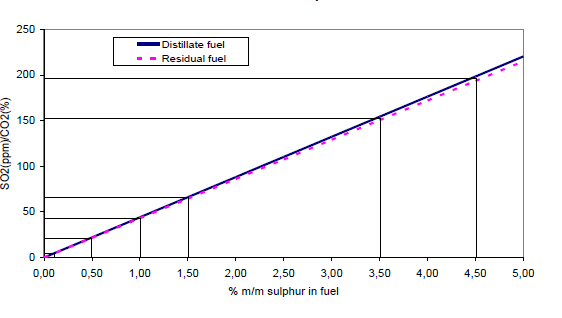
3.1 Note that the SO2/CO2 ratio varies slightly from
distillate to residual fuel. This occurs because of the very different atomic
hydrogen-to-carbon ratios (H:C) of the two fuels. Figure 1 illustrates the extent of the
SO2/CO2 ratios' sensitivity to H:C over a broad range of H:C
and fuel sulphur concentrations. From Figure 1, it can be concluded that for fuel
sulphur levels less than 3.0% sulphur, the difference in S/C ratios for distillate and
residual fuel is less than 5.0%.
3.2 In the case of using non-petroleum fuel oils, the appropriate
SO2/CO2 ratio applicable to the values given in regulations
14.1 and/or 14.4 of MARPOL Annex VI will be subject to approval by the
Administration.
Table 1: Fuel properties for marine distillate and residual fuel*
|
|
Carbon
|
Hydrogen
|
Sulphur
|
Other
|
C
|
H
|
S
|
Fuel S/C
|
Exh
SO2/CO2
|
| Fuel Type
|
%(m/m)
|
%(m/m)
|
%(m/m)
|
%(m/m)
|
mol/kg
|
mol/kg
|
mol/kg
|
mol/mol
|
ppm/%(v/v)
|
| Distillate
|
86.20
|
13.60
|
0.17
|
0.03
|
71.8333
|
136
|
0.0531
|
0.00074
|
7.39559
|
| Residual
|
86.10
|
10.90
|
2.70
|
0.30
|
71.7500
|
109
|
0.8438
|
0.01176
|
117.5958
|
| Distillate
|
85.05
|
13.42
|
1.50
|
0.03
|
70.8750
|
134.2
|
0.4688
|
0.006614
|
66.1376
|
| Residual
|
87.17
|
11.03
|
1.50
|
0.30
|
72.6417
|
110.3
|
0.4688
|
0.006453
|
64.5291
|
* Based on properties in the IMO NOx Monitoring Guidelines, resolution MEPC.103(49).
Table 2: Emissions calculations corresponding to 1.5 % fuel
sulphur
|
|
CO2
|
SO2
|
Exh
SO2/CO2
|
Exh S/C
|
|
|
%
|
ppmfootnote
|
ppmfootnote/%
|
m/m
|
| Distillate 0.17% S
|
8
|
59.1
|
7.4
|
0.00197
|
| Residual 2.70% S
|
8
|
939.7
|
117.5
|
0.03136
|
|
|
|
|
|
|
| Distillate 1.5% S
|
8
|
528.5
|
66.1
|
0.01764
|
| Residual 1.5% S
|
8
|
515.7
|
64.5
|
0.01721
|
|
|
|
|
|
|
| Distillate 1.5% S
|
0.5
|
33.0
|
66.1
|
0.01764
|
| Residual 1.5% S
|
0.5
|
32.2
|
64.5
|
0.01721
|
SO2/CO2 ratio vs % sulphur in fuel
4 Correspondence between 65 (ppmfootnote/%) SO2/CO2 and 6.0
g/kWh is demonstrated by showing that their S/C ratios are similar. This requires the
additional assumption of a brake-specified fuel consumption value of 200 g/kWh. This is
an appropriate average for marine diesel engines. The calculation is as follows:

- brake-specific SO2 = 6.0 g/kW-hr
- MWS = 32.065 g/mol
- MWSO2 = 64.064 g/mol
- BSFC = 200 g/kW-hr
- % carbon in 1.5% sulphur fuel (from table 1) = 85.05% (distillate) or
87.17% (residual)


Note 1: The S/C mass ratios calculated above, based on 6.0 g/kWh and 200
g/kWh BSFC, are both within 0.10% of the S/C mass ratios in the emissions table (Table
2). Therefore, 65 (ppmfootnote/%) SO2/CO2 corresponds
well to 6.0 g/kWh.
Note 2: The value of 6.0 g/kWh, hence the 200g/kWh brake-specified fuel
consumption is taken from MARPOL Annex VI as adopted by the 1997 MARPOL Conference.
5 Thus, the working formulas are as follows:
For complete combustion = 
For incomplete combustion = 
* Note: Gas concentrations must be sampled or converted to the same residual
water content (e.g. fully wet, fully dry).
6 The following is the basis of using the (ppm
footnote/%) SO
2/CO
2 as the limit
for determining compliance with regulation
14.1 or
14.4 of MARPOL Annex VI:
- .1 This limit can be used to determine compliance from fuel oil
burners that do not produce mechanical power.
- .2 This limit can be used to determine compliance at any power
output, including idle.
- .3 This limit only requires two gas concentration measurements at
one sampling location.
- .4 There is no need to measure any engine parameters such as engine
speed, engine torque, engine exhaust flow, or engine fuel flow.
- .5 If both gas concentration measurements are made at the same
residual water content in the sample (e.g., fully wet, fully dry), no dry-to-wet
conversion factors are required in the calculation.
- .6 This limit completely decouples the thermal efficiency of the
fuel oil combustion unit from the EGC unit.
- .7 No fuel properties need to be known.
- .8 Because only two measurements are made at a single location,
transient engine or EGCS unit effects can be minimized by aligning signals from
just these two analysers. (Note that the most appropriate points to align are
the points where each analyser responds to a step change in emissions at the
sample probe by 50% of the steady-state value.)
- .9 This limit is independent of the amount of exhaust gas dilution.
Dilution may occur due to evaporation of water in an EGC unit, and as part of an
exhaust sampler's preconditioning system.