3.1 The Revised Interim Guidelines contain probability
density functions (pdf's) describing the location, extent and penetration
of side and bottom damage. These functions were derived from historical
damage statistics for 52 collisions and 63 groundings, compiled by
the classification societies at IMO's request (2)
footnote. These statistics were derived from casualties
to oil tankers, chemical tankers, and combination carriers of 30,000
tonnes deadweight and above, for the period 1980 to 1990.
3.2
Figure 1 shows
the statistic data and piecewise linear probability density function,
representing the longitudinal extent of damage when subject to bottom
damage. Other forms of curve fitting such as beta distributions were
also considered. However, they were found to have little impact on
the overall analysis, and therefore the easier to apply piecewise
linear fit was adopted for the Revised Interim Guidelines.
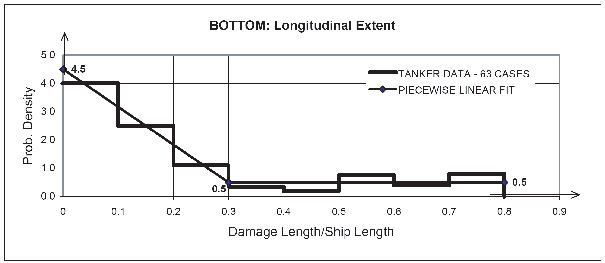
Histogram and Probability Density Function: Longitudinal Extent of Bottom Damage
3.3 Side damage pdf's as shown in figures 2 through 6 provide the probability
of damage as a function of:
- Longitudinal location
- Longitudinal extent
- Vertical location
- Vertical extent
- Transverse penetration
3.4 Bottom damage pdf's as shown in figures 7 through 11 provide the
probability of damage as a function of:
- Longitudinal location
- Longitudinal extent
- Transverse location
- Transverse extent
- Vertical penetration
3.5 The density scales are normalized by the ship
length for longitudinal location and extent, by ship breadth for transverse
location and extent, and by ship depth for vertical location and extent.
The pdf variables are treated independently for the lack of adequate
data to define their dependency.